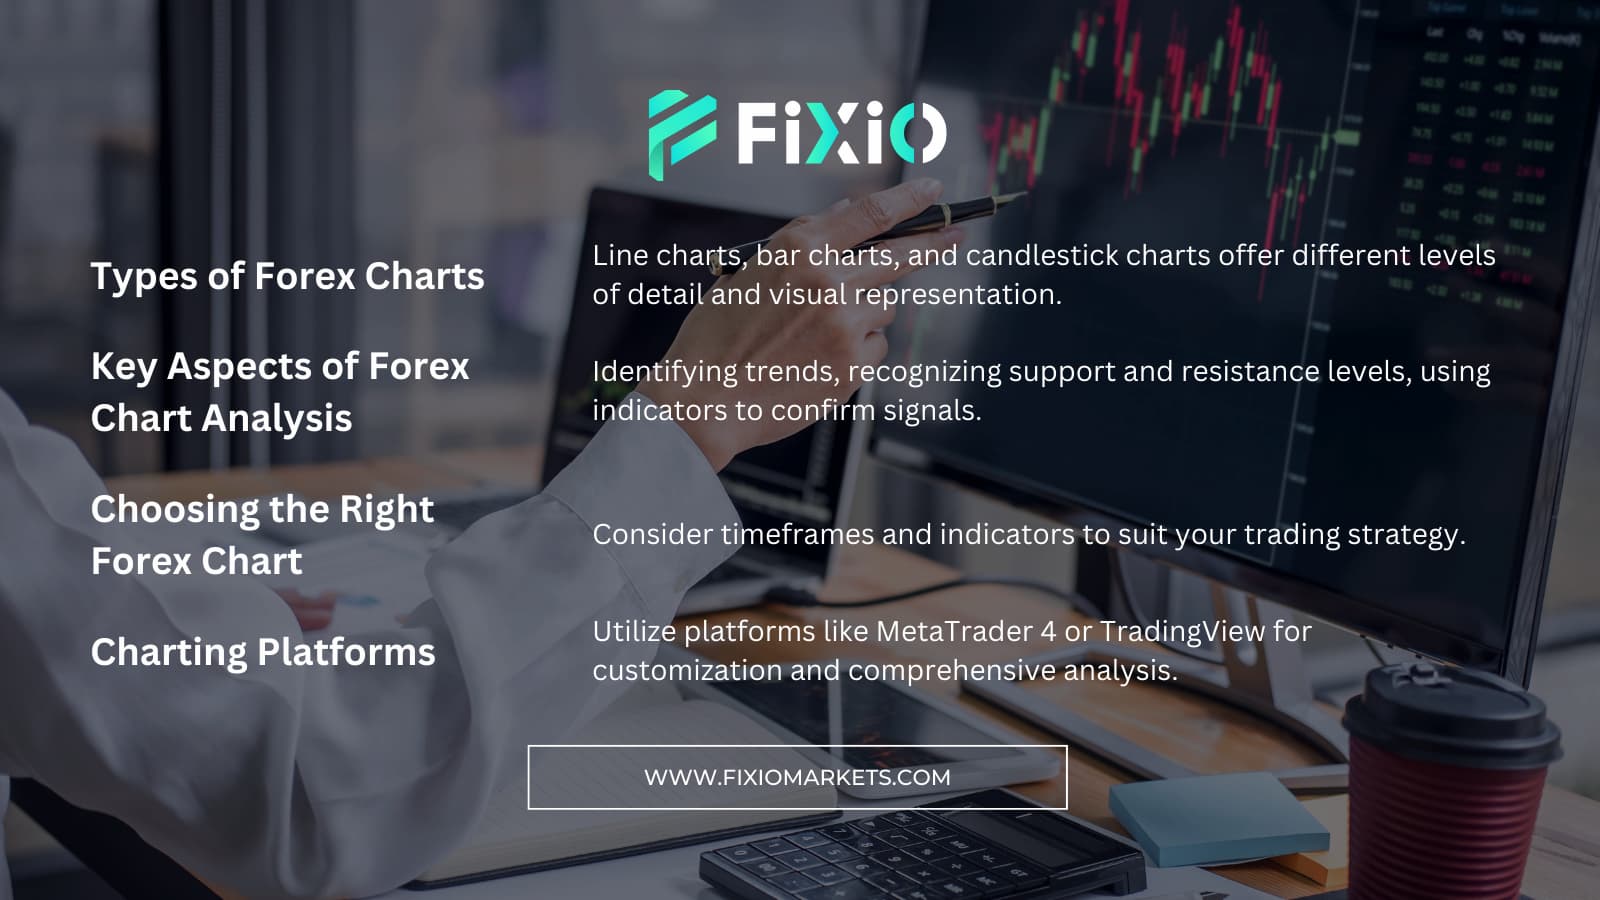
When engaging in the Forex market, understanding how to read charts is crucial for making informed trading decisions. With various chart types available, each provides unique insights into market movements. The right choice depends on your strategy. In this article, we will explore the most common types of Forex charts, discuss key aspects of chart analysis, and guide you on selecting the right chart for your trading needs.
There are three major types of Forex charts that traders commonly use. Understanding how to read them helps in identifying price trends and potential market movements.
Line charts are the simplest type of chart, showing only the closing prices of a currency pair over time. While they offer a basic view of market trends, they don't reveal intraday price action, which limits deeper analysis. However, they are great for a quick overview of closing price movements.
Bar charts offer more detailed information than line charts. Each bar represents a specific time period, such as a day or an hour, showing the open, high, low, and closing prices. This allows traders to gauge price ranges and direction more effectively, providing better insight for trading decisions.
Candlestick charts build upon bar charts by visually illustrating price movements. They are highly favored due to their clarity. Green or white candlesticks indicate a price rise, while red or black ones indicate a decline. The shape of the candlestick helps identify trends and reversals, making them ideal for both beginner and advanced traders.
Once familiar with the different types of charts, the next step is mastering analysis techniques to make informed trading decisions.
Spotting trends is fundamental. You want to trade in the direction of the overall market trend. Candlestick charts make it easier to spot trends. Look out for reversal patterns such as head and shoulders or double tops, which suggest that the trend may change direction.
Support levels act as price floors where downtrends stop, while resistance levels function as ceilings where uptrends may reverse. Identifying these levels helps you choose optimal entry and exit points for trades.
Indicators like moving averages, the Relative Strength Index (RSI), and oscillators like the Stochastic oscillator provide confirmation of chart patterns. For example, a price break above the moving average may indicate the start of an uptrend, making it a valuable tool in decision-making.
With a variety of charts and analysis methods available, choosing the right one is key to your trading success.
Longer timeframes, such as daily or weekly charts, are useful for identifying overall trends. Shorter timeframes, like 5-minute charts, are helpful for pinpointing entry and exit points.
Limit your indicators to 2-3 to avoid overwhelming your charts. For example, use one trend-following indicator, like moving averages, and one oscillator, like the RSI, for a well-rounded view of the market.
Platforms like MetaTrader 4 or TradingView offer robust tools to customize your charts. These platforms provide access to various currency pairs, timeframes, and indicators, enabling comprehensive market analysis.
Don't miss the latest Forex trading news and analysis. Be sure to visit our website to stay updated on market trends: Visit Fixio Markets.


Learn how to read Forex trading charts to make informed decisions. Understand line, bar, and candlestick charts, and analyze market trends.
Superior trade execution & trading conditions with the NDD method.

The online FX industry provides a platform for investors worldwide to engage in the buying and selling.

Subscribe to our daily newsletter and get the best forex trading information and markets status updates
Trade within minutes!
Comment (0)